Understanding SWOT Analysis
To effectively analyze business strategies and risks, companies often turn to SWOT analysis. SWOT, which stands for Strengths, Weaknesses, Opportunities, and Threats, is a strategic planning tool that helps identify both internal and external factors that can impact the achievement of business objectives.
What is SWOT Analysis?
SWOT analysis is a methodical approach to assess an organization’s current situation and future prospects. It involves evaluating the following elements:
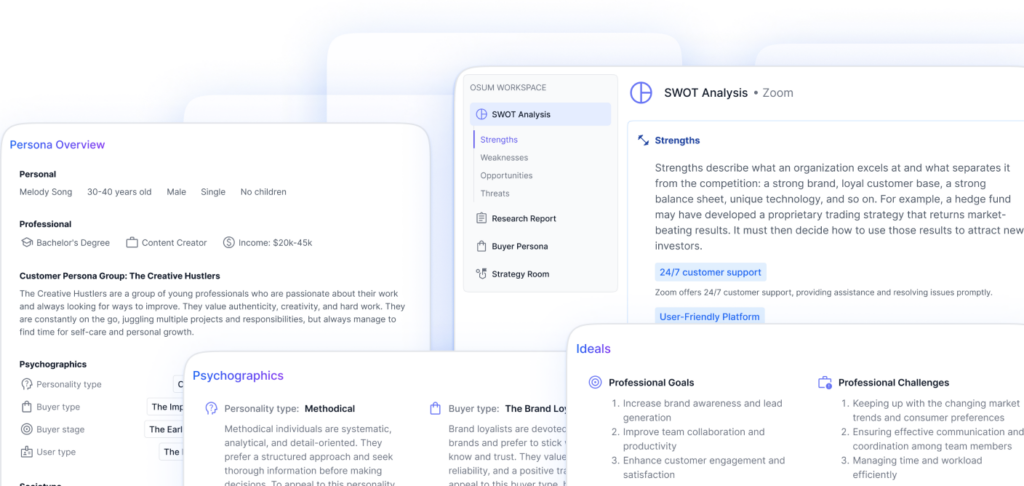
- Strengths: Internal factors that contribute to the organization’s competitive advantage or uniqueness.
- Weaknesses: Internal factors that hinder the organization’s performance or put it at a disadvantage.
- Opportunities: External factors that present potential advantages or areas for growth.
- Threats: External factors that pose challenges or risks to the organization’s success.
By conducting a SWOT analysis, businesses gain valuable insights into their position in the market, enabling them to make informed decisions and develop effective strategies.
Benefits of SWOT Analysis
SWOT analysis offers several key benefits to businesses, including:
- Strategic Planning: SWOT analysis provides a structured framework for evaluating internal and external factors, helping businesses develop effective strategies and prioritize actions.
- Improved Decision-Making: By identifying strengths, weaknesses, opportunities, and threats, organizations can make data-driven decisions and allocate resources more efficiently.
- Risk Assessment: SWOT analysis helps businesses identify potential risks and vulnerabilities, allowing them to proactively address and mitigate these challenges.
- Competitive Advantage: By understanding their strengths and leveraging opportunities, organizations can gain a competitive edge in the market.
- Enhanced Communication: SWOT analysis facilitates effective communication and collaboration within teams and stakeholders, ensuring everyone is aligned with the organization’s goals and challenges.
By utilizing SWOT analysis, companies can gain a comprehensive understanding of their internal and external landscape, enabling them to make informed decisions and drive business success.
In the next sections, we will explore how Tableau, a powerful data visualization platform, can be leveraged to conduct SWOT analysis and translate data into meaningful insights.
Introduction to Tableau
To conduct a thorough and precise SWOT analysis, it is crucial to utilize powerful data visualization tools. One such tool that stands out is Tableau. With its robust features and capabilities, Tableau empowers organizations to transform data into actionable insights, making it an ideal choice for conducting SWOT analysis.
What is Tableau?
Tableau is a leading business intelligence and analytics tool that enables users to visually explore and analyze data effectively. It provides a user-friendly interface with drag-and-drop functionality, making it accessible for users with varying levels of technical expertise to perform complex data analysis. By leveraging Tableau, organizations can turn data into interactive dashboards, reports, and visualizations, facilitating informed decision-making processes.
Key Features of Tableau
Tableau offers a wide range of features that make it a powerful tool for conducting SWOT analysis. Some of its key features include:
-
Data Integration: Tableau allows seamless integration of data from various sources, including databases, spreadsheets, cloud services, and more. This capability provides a comprehensive view of the data landscape, enabling a deeper understanding of the factors impacting the organization’s strengths, weaknesses, opportunities, and threats (Tableau).
-
Interactive Visualization: With Tableau, users can create interactive dashboards and reports that bring data to life. The software provides a diverse set of visualization options, allowing users to depict data in a visually compelling and easily understandable manner. This interactivity enhances the analysis and helps stakeholders gain valuable insights (Tableau).
-
Data Exploration: Tableau’s intuitive interface enables users to explore data from multiple angles, facilitating a comprehensive understanding of the strengths, weaknesses, opportunities, and threats identified in the SWOT analysis. The ability to drill down into the data and apply filters empowers users to uncover hidden patterns and trends, leading to more informed decision-making (BDC).
-
Collaboration and Sharing: Tableau promotes collaboration by allowing users to share visualizations, dashboards, and reports across the organization. This feature facilitates cross-functional discussions and ensures that stakeholders have access to the latest insights, fostering a collaborative and data-driven decision-making culture (Tableau).
By utilizing Tableau, organizations can harness the power of data visualization to conduct SWOT analysis effectively. The software’s intuitive interface, data integration capabilities, interactive visualization options, and collaboration features make it a valuable tool for gaining actionable insights and making informed strategic decisions.
Leveraging Tableau for SWOT Analysis
When it comes to conducting a SWOT analysis, Tableau provides a powerful platform for data visualization and analysis. By leveraging Tableau’s capabilities, businesses can seamlessly integrate data from various sources, visualize strengths and weaknesses, and identify opportunities and threats.
Integrating Data Sources
Tableau allows for seamless data integration from various sources, including databases, spreadsheets, cloud services, and more, providing a comprehensive view of the data landscape. By integrating various data sources into Tableau, businesses can gain insights for their SWOT analysis from sources such as spreadsheets, databases, cloud services, and live data streams, enhancing the overall analysis process with diverse data inputs (Tableau). This integration ensures that decision-makers have access to accurate and up-to-date information when conducting their SWOT analysis.
Visualizing Strengths and Weaknesses
Tableau’s interactive dashboards and visuals enable businesses to conduct a comprehensive SWOT analysis that is easy to interpret, customize, and share with stakeholders, facilitating collaboration and informed decision-making based on the analysis (Tableau). Using Tableau’s visualization capabilities, businesses can create charts, graphs, and other visual representations to highlight and compare strengths and weaknesses within their organization. These visualizations help stakeholders gain a clear understanding of the internal factors that impact the business’s performance.
Identifying Opportunities and Threats
Tableau can be used for SWOT analysis by creating a traditional SWOT matrix, incorporating ready-made templates, and using a variety of visualizations to depict strengths, weaknesses, opportunities, and threats effectively. By analyzing external factors such as market trends, competitor analysis, and customer insights, businesses can identify potential opportunities and threats. Tableau’s data visualization capabilities enable businesses to present this information in an intuitive and accessible manner, allowing decision-makers to identify key areas for improvement and growth.
By leveraging Tableau for SWOT analysis, businesses can gain actionable insights and visual representations of their strategic planning, facilitating the identification of key areas for improvement and growth (BDC). Tableau’s ability to integrate data from various sources, visualize strengths and weaknesses, and identify opportunities and threats makes it a valuable tool for businesses looking to conduct a comprehensive and data-driven SWOT analysis.
Creating a SWOT Analysis in Tableau
When it comes to conducting a SWOT analysis, Tableau provides a powerful platform for businesses to visually represent their strengths, weaknesses, opportunities, and threats. By leveraging Tableau’s data visualization capabilities, businesses can gain valuable insights and make informed decisions based on their analysis.
Building a SWOT Matrix
To create a SWOT analysis in Tableau, start by integrating various data sources into the platform. Tableau allows businesses to connect to spreadsheets, databases, cloud services, and live data streams, providing a comprehensive view of the data needed for the analysis. By bringing together data from different sources, businesses can ensure a more holistic and accurate representation of their strengths, weaknesses, opportunities, and threats.
Once the data is integrated, businesses can use Tableau’s interactive dashboards and visuals to build a SWOT matrix. This matrix consists of four quadrants representing the different aspects of the analysis. The strengths and weaknesses are typically represented on the internal axis, while opportunities and threats are represented on the external axis. With Tableau’s drag-and-drop interface, businesses can easily map their data to the appropriate quadrants, creating a clear and concise visualization of their SWOT analysis.
Customizing Dashboards and Reports
Tableau offers a high level of customization, allowing businesses to tailor their dashboards and reports to their specific needs. Through Tableau’s intuitive interface, businesses can customize the appearance of their SWOT analysis, including the colors, fonts, and layout. This customization ensures that the analysis aligns with the company’s branding and visual preferences.
Furthermore, businesses can enhance their SWOT analysis by incorporating additional visuals and charts into their dashboards. For example, they can create bar charts to showcase the relative importance of each strength, weakness, opportunity, and threat. By using Tableau’s extensive library of visualization options, businesses can present their SWOT analysis in a visually appealing and informative manner.
Sharing and Collaboration
Tableau facilitates collaboration and knowledge sharing by allowing businesses to easily share their SWOT analysis with stakeholders. With Tableau’s sharing capabilities, businesses can publish their dashboards and reports online, making them accessible to team members, executives, and other relevant parties. This enables stakeholders to view and interact with the SWOT analysis, providing valuable input and insights.
Additionally, Tableau’s collaboration features allow for real-time collaboration, where team members can work together on the same analysis simultaneously. This fosters collaboration, enhances data-driven discussions, and helps in making informed decisions based on the SWOT analysis.
By utilizing Tableau for SWOT analysis, businesses can benefit from its robust data visualization capabilities, customizable dashboards, and easy sharing and collaboration features. This empowers businesses to conduct a comprehensive SWOT analysis that is not only visually appealing but also facilitates data-driven decision-making.
Best Practices for SWOT Analysis with Tableau
When conducting a SWOT analysis using Tableau, it’s important to utilize the features and functionalities that Tableau offers to maximize the effectiveness of the analysis. Here are some best practices to consider:
Utilizing Interactive Features
Tableau’s interactive features enable businesses to conduct a comprehensive SWOT analysis that is easy to interpret, customize, and share with stakeholders, facilitating collaboration and informed decision-making based on the analysis. With Tableau, users can create dynamic dashboards and visuals that allow for exploration and interaction with the data. This interactivity enhances the engagement and understanding of the SWOT analysis results, enabling users to dive deeper into specific areas of interest. By leveraging Tableau’s interactive features, businesses can gain a more comprehensive understanding of their strengths, weaknesses, opportunities, and threats.
Incorporating Contextual Data
One of the advantages of using Tableau for SWOT analysis is the ability to add context to the data. Contextual data provides additional information that helps in understanding the significance and implications of the strengths, weaknesses, opportunities, and threats identified in the analysis. By incorporating contextual data into the analysis, businesses can gain a deeper understanding of the factors that contribute to their current situation and future prospects. This contextual information can come from various sources such as industry reports, market trends, customer feedback, or internal data. By integrating contextual data into the SWOT analysis, Tableau enables businesses to make more informed decisions and develop strategies that align with their goals.
Gaining Actionable Insights
One of the primary goals of conducting a SWOT analysis is to gain actionable insights that can drive business decisions and strategic planning. Tableau’s data visualization capabilities play a crucial role in this aspect. By visualizing the strengths, weaknesses, opportunities, and threats in a visually appealing and intuitive manner, Tableau helps businesses identify patterns, trends, and relationships within the data. These visual representations provide a clear and concise overview of the analysis, making it easier to identify key areas for improvement and growth. With Tableau, businesses can transform their SWOT analysis into actionable insights that drive meaningful change and propel the organization forward.
By following these best practices and leveraging the power of Tableau, businesses can conduct SWOT analysis with precision and confidence. Tableau’s capabilities for interactive visualization, contextual data integration, and actionable insights empower organizations to make informed decisions and develop strategies that capitalize on their strengths and opportunities while addressing their weaknesses and threats.
Limitations and Considerations
While Tableau is a powerful tool for conducting SWOT analysis, it’s important to be aware of its limitations and considerations. Understanding these factors can help users make informed decisions when utilizing Tableau for their SWOT analysis.
Performance with Large Datasets
One limitation of Tableau is its performance with large datasets. As data volume increases or when data is spread across different systems, Tableau Desktop’s performance can degrade. To optimize performance, it may be necessary to create extracts, which are subsets of the data that can be stored in Tableau’s proprietary format. These extracts allow for faster querying and analysis of large datasets. By leveraging extracts, users can ensure that Tableau operates efficiently even with substantial amounts of data (Datameer Blog).
Collaboration Challenges
Collaboration is essential when conducting a SWOT analysis, as it involves multiple stakeholders and team members. However, Tableau Desktop does not offer direct online publishing capabilities, which can hinder collaboration among analytics teams. This limitation becomes particularly significant in today’s remote work environment, where seamless online collaboration is crucial. To address this challenge, organizations can explore alternative solutions or utilize Tableau Server or Tableau Online, which provide online publishing and collaboration features (Datameer Blog).
Advanced Statistical Analysis
Tableau’s primary strength lies in its data visualization and interactivity capabilities. However, it may not be optimized for advanced statistical analysis or complex calculations. Tableau Desktop lacks a scripting layer, which can limit the ability to perform sophisticated calculations or handle complex data analytics tasks. While Tableau offers level-of-detail (LOD) functions to address this limitation, it may not be as intuitive as other business intelligence (BI) tools with scripting layers. Users who require advanced statistical analysis may need to explore alternative solutions or consider leveraging external tools or scripting layers alongside Tableau.
Understanding these limitations and considerations is essential to effectively leverage Tableau for SWOT analysis. Despite these limitations, Tableau remains a valuable tool for visualizing and analyzing data, enabling users to create impactful and insightful SWOT analyses. By being aware of these factors, users can make informed decisions and explore workarounds to mitigate any potential challenges they may encounter.
Real-World Examples of SWOT Analysis with Tableau
To understand the practical application of SWOT analysis using Tableau, let’s explore some real-world examples where organizations have leveraged this powerful combination to gain valuable insights and make informed decisions.
Shell’s Scenario Planning
Shell, a global energy company, has successfully utilized scenario planning in the 1970s with their “Signals and Signposts” approach. This strategy helped them adapt to changing energy landscapes and anticipate future scenarios, such as the oil crisis and the rise of renewable energy. By combining scenario planning with Tableau’s data visualization capabilities, Shell was able to analyze and visualize complex data sets, allowing them to make strategic decisions based on the insights gained. This approach enabled them to navigate through uncertainties and adapt their business strategies effectively, ensuring long-term success.
World Wildlife Fund’s Living Planet Scenarios
The World Wildlife Fund (WWF), a leading conservation organization, developed the “Living Planet Scenarios” using Tableau. These scenarios were designed to explore different future pathways for biodiversity conservation. By integrating data from various sources into Tableau, WWF was able to visualize and analyze the potential impacts of different scenarios on biodiversity. This data-driven approach guided their conservation efforts, priorities, and advocacy for sustainable practices. Tableau’s interactive visualizations provided a clear understanding of the complex relationships between biodiversity, human activities, and environmental factors, enabling WWF to develop effective strategies for conservation (Faster Capital).
Applying Scenario Planning to Businesses and Governments
Scenario planning using Tableau is not limited to large corporations or environmental organizations. It can be applied to businesses of all sizes and across various industries. For example, a fictional restaurant chain facing changing consumer preferences and economic fluctuations can utilize scenario planning in Tableau to develop adaptable and resilient strategies for long-term success. By analyzing different scenarios and visualizing the potential impacts on sales, customer preferences, and market trends, the restaurant chain can make informed decisions and proactively respond to changing circumstances.
Similarly, governments and policymakers can leverage scenario planning in Tableau to envision alternative futures and craft effective public policies. For instance, a city facing population growth and climate change challenges can explore scenarios related to sustainable urban planning, renewable energy adoption, and infrastructure development. By analyzing and visualizing the potential outcomes of different scenarios, policymakers can make data-driven decisions and develop strategies that lead to a more sustainable and resilient future.
Through these real-world examples, it becomes evident that combining scenario planning with Tableau’s powerful visual analytics capabilities provides organizations with a comprehensive framework for making informed decisions in the face of uncertainties. By integrating diverse data sources, visualizing strengths, weaknesses, opportunities, and threats, and gaining actionable insights, organizations can navigate complex challenges and seize new opportunities for growth and success.